By: Nate Bek
If you handed me a dollar to invest in a startup, three metros would give me the best shot at returning $10: the Bay Area, Boston, and Seattle.
An Ascend analysis of venture capital efficiency across major U.S. cities reveals that while Silicon Valley maintains its lead in generating returns, Boston and Seattle are closing the gap with strong performance on smaller capital bases. The findings suggest that investors may be overlooking high-performing emerging markets in favor of legacy tech hubs.
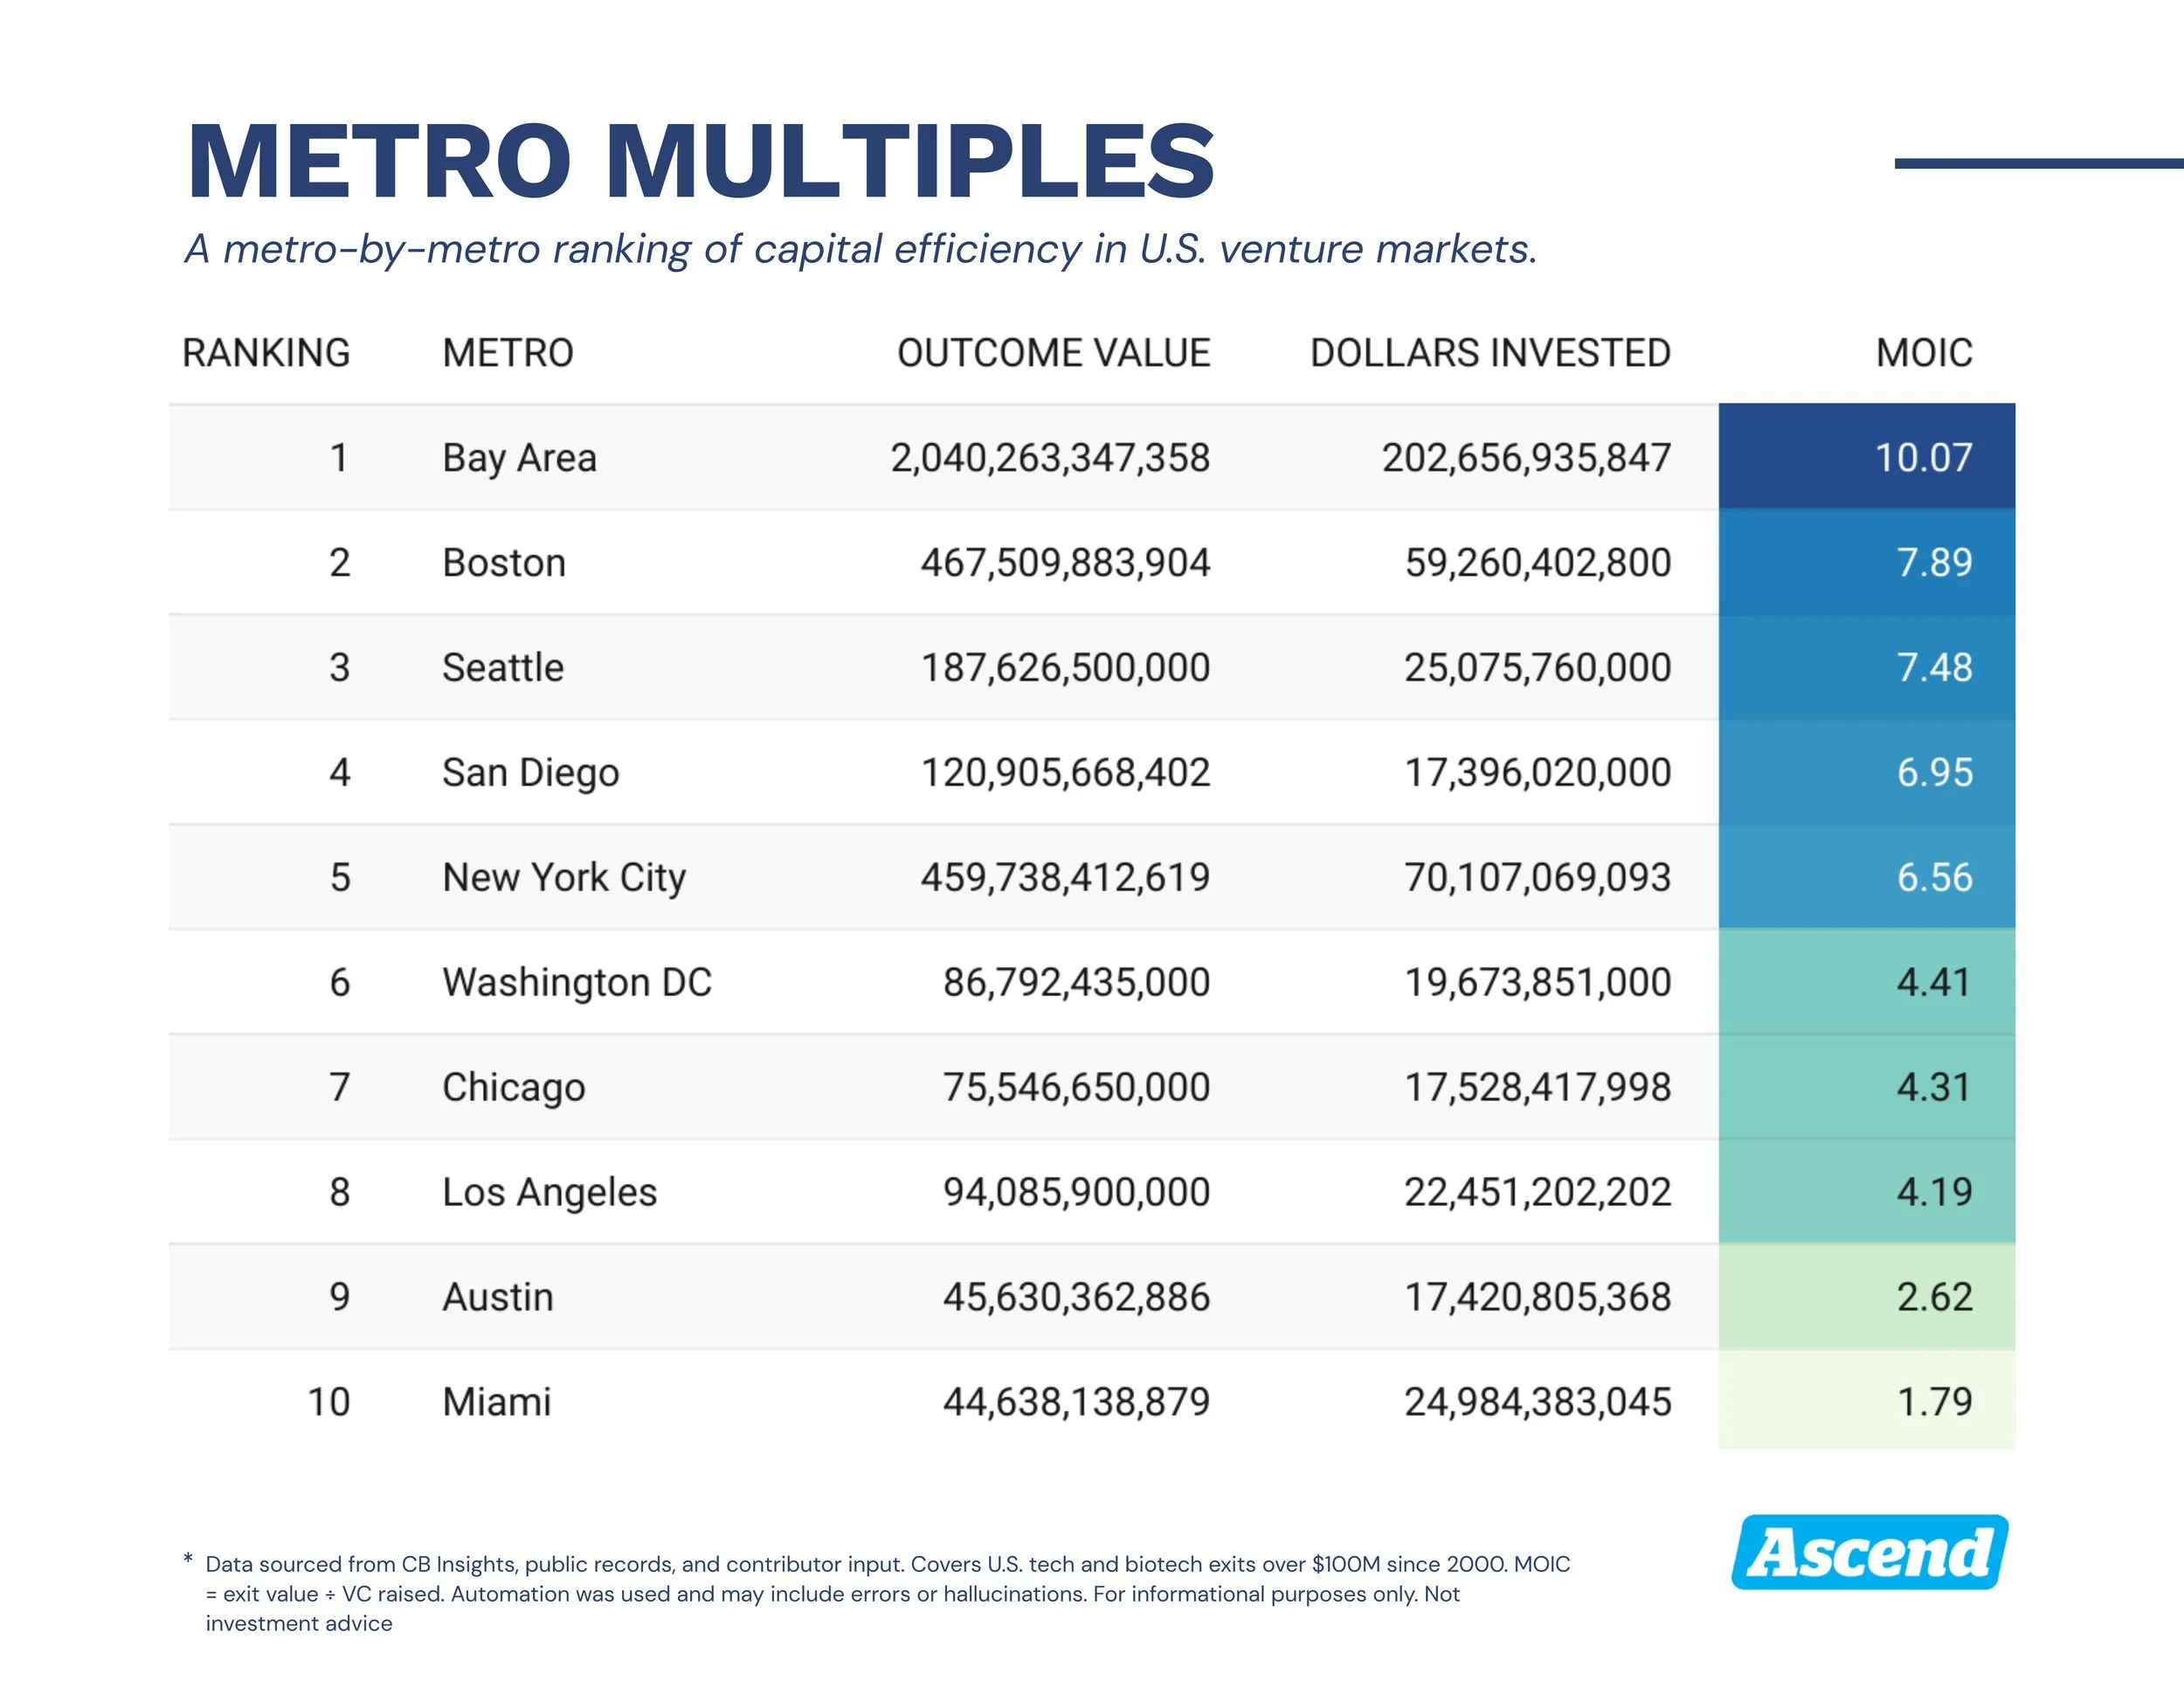
The Bay Area leads with a Multiple on Invested Capital, or MOIC, of 10.07. Boston follows at 7.89. The biggest surprise? Seattle, long viewed as a second tier ecosystem, lands third with a MOIC of 7.48.
MOIC, the core metric in this study, divides total exit value by total venture capital invested. It captures actual returns through IPOs and acquisitions, removing the influence of inflated private valuations or unrealized marks. The data includes tech and biotech exits over $100 million between 2000 and mid-2025.
Silicon Valley companies raised more than $200 billion in that time and generated over $2 trillion in exit value. The region’s $2.56 billion average exit was lifted by several outliers, including Meta’s $104 billion IPO in 2012.
Boston startups raised $59.3 billion and delivered $467.5 billion in exits. Seattle companies attracted just $25.1 billion in investment and returned $187.6 billion. Despite its lower volume, Seattle’s average exit — $1.63 billion — was higher than Boston’s and second only to the Bay Area. Its largest deal was Pfizer’s $43 billion acquisition of Seagen.
(Hover over the regions to get their MOIC numbers compared to exit value. Read our methodology below.)
Both Boston and Seattle reflect the long-term advantages of regional specialization. In Boston, life sciences dominate. Proximity to research institutions, regulatory experience, and a deep bench of clinical operators have fueled a steady stream of biotech exits. The $39 billion sale of Alexion Pharmaceuticals to AstraZeneca remains among the largest.
Seattle’s strength lies in enterprise infrastructure. Microsoft and Amazon seeded a generation of engineering talent, much of it concentrated in cloud computing, dev tools, and AI systems.
San Diego ranked fourth, with a MOIC of 6.95. The metro raised $17.4 billion and produced $120.9 billion in exits. Its biotech sector follows a familiar pattern: fewer bets, longer time horizons, and outsized returns when drugs reach market.
New York placed fifth at 6.56, on $70.1 billion invested. Its strength in fintech and enterprise software produced consistent returns, though its average exit was smaller.
The remaining metros performed at a lower tier. Washington, D.C. posted a 4.41 MOIC, shaped by government services and defense technologies. Chicago and Los Angeles returned just over 4. Austin, despite its profile as an emerging tech hub, posted 2.62. Miami finished last at 1.79.
The results reveal persistent disparities in capital efficiency. Some of the country’s fastest-growing markets still lag in outcomes, while quieter cities convert dollars with precision. These differences matter more in a constrained funding environment, as LPs push for clarity on where capital is working hardest.
The industry has long favored concentration. Much of that remains rational. Silicon Valley still has unmatched density and depth. But the data suggests the gap is not as wide as capital flows imply. Cities like Boston and Seattle have outperformed on a relative basis for years, and with far less capital in play.
Venture returns are nonlinear. One company can change the trajectory of a hub. But ecosystems that consistently generate high-efficiency outcomes tend to have more than luck on their side. They have technical lineage, operator networks, and capital discipline. Those ingredients don’t guarantee success, but they give each dollar a better chance.
If the goal is to turn one dollar into ten, a few places are doing it better than most. That should inform how money moves next.
If you are looking to get the raw data, contact the head of CB Insights jason.saltzman@cbinsights.com. Thomas Stahura contributed to this report.
Methodology
This analysis was conducted to assess capital efficiency across selected U.S. startup ecosystems. Specifically, we sought to estimate where venture capital investment has historically yielded the highest return in terms of exit value.
To do so, we constructed a custom dataset of U.S.-based, venture-backed startup exits with disclosed or estimated values of at least $100 million, covering the period from January 1, 2000, through June 30, 2025. The principal metric used was MOIC (Multiple on Invested Capital), calculated as the ratio of total exit value to total known venture capital raised for each company.
The initial dataset was sourced from CB Insights, which provided foundational exit data. We supplemented this dataset using a web browser automation tool to extract additional information from publicly available sources, including press releases, SEC filings, media reports, and corporate websites. Where automation proved insufficient, we conducted manual enrichment and verification. This process included spreadsheet review, data cleaning, and, in some cases, direct outreach.
We excluded transactions involving non-technology companies. For example, companies in categories such as food and beverage, real estate, or hospitality were removed, even if they appeared in the raw dataset. All companies included had to meet two criteria: (1) the company must have raised verifiable venture capital prior to exit; and (2) the company must have exited via acquisition, public offering, or other liquidity event with a disclosed or credibly estimated value of at least $100 million.
Private equity–backed companies, spinouts, and founder-owned businesses were excluded unless we identified credible evidence of venture capital participation.
We created our own metro area categorization, loosely informed by Startup Genome's global ecosystem rankings. Ten metro areas were selected for inclusion. We made a discretionary decision to include Austin and to exclude Philadelphia, with the intent of focusing on the most active and publicly visible startup hubs. We acknowledge this selection introduces subjectivity into the dataset’s geographic framework.
Biases and Limitations
The authors of this analysis are based in Seattle, Washington, and maintain professional networks concentrated in the Pacific Northwest region. One author is a former technology journalist with enhanced access to local records and contacts. This may have resulted in higher data completeness for Seattle-based companies, including additional exit events and more precise investment totals not reflected in the original CB Insights dataset.
Although we attempted to apply consistent standards across all regions, the availability of region-specific information varied, and our local knowledge likely influenced the dataset composition. This may have introduced a slight bias in favor of Seattle-related data volume and completeness.
This was a two-person project conducted without institutional resources. Data collection and validation occurred over a period of approximately three months, using both automated and manual methods. While extensive effort was made to ensure accuracy, the dataset is not comprehensive, and some exits or funding amounts may have been omitted or misclassified.
This analysis is presented for informational purposes only. It should not be relied upon for investment decisions or used as the sole basis for assessing regional venture capital performance.